Glaciers, Ice Sheets, and Climate Change
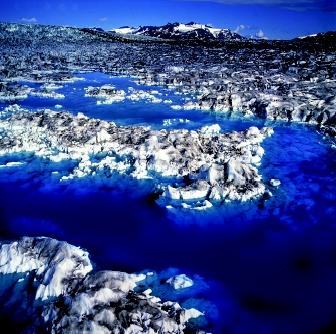
Glaciers and ice sheets both affect and are affected by changes in Earth's climate. They are frozen fresh-water reservoirs that change volume in response to changes in temperature and snowfall. Were the ice sheets in Greenland and Antarctica to melt entirely, global sea level would rise about 75 meters (250 feet). Those great polar ice sheets also contribute to the formation of cold, salty sea water that sinks to fill the deep ocean. When the ice forms, it uses only water; the dissolved salts are left behind, increasing the water's salinity. And ice and snow play a role in the global energy balance by reflecting from 60 to 90 percent of the solar radiation they receive. On a scale more relevant to peoples' daily lives, the seasonal melting of mountain glaciers contributes to summertime river flow and to the ongoing sea-level rise.
Today, permanent ice covers a little less than 10 percent of Earth's land surface, yet contains almost 87 percent of its fresh water. The majority of the ice, 29 × 10 6 cubic kilometers (approximately 7 million cubic miles), is in Antarctica. The Greenland Ice Sheet holds 2.95 × 10 6 cubic kilometers (706,000 cubic miles) of ice, whereas glaciers and ice caps amount to about 0.18 × 10 6 cubic kilometers (43,000 cubic miles). Although glaciers and ice caps make up less than 1 percent of Earth's terrestrial ice volume, their small size allows them to respond rapidly to climate change.
Changes in Glaciers, Ice Sheets, and Ice Shelves
Glaciers store water over relatively long timescales compared to rivers and lakes—hundreds to a few thousands of years. Ice sheets store water for even longer—tens of thousands of years. But the shorter glacier timescales are comparable to human timescales, so people notice how glaciers change, and these changes have obvious impacts on the human environment. Many river systems depend on glacier melt, which maintains the water supply through the summer. As glaciers shrink, so does the frozen water supply they store. This is one of the reasons why it is important to measure how and understand why glaciers change over time.
Glacier meltwater eventually makes its way to the ocean, where it can affect global sea level. As terrestrial ice masses grow, sea level falls; and as masses shrink, sea level rises. At the last glacial maximum, about 18,000 years ago, the growth of ice sheets and glaciers caused sea level to lower by about 120 meters (395 feet). Most of that change was due to the formation of large ice sheets in northern North America and Europe, but mountain glaciers, too, had their role.
Glacier change may be quantified by a change in length, by a change in the surface area covered, or most rigorously by the glacier's mass balance, the difference between the volume of ice accumulated from snowfall and the volume of ice lost to melting or iceberg calving in a year. A glacier is "in balance" when gains and losses are equal. Because glaciers and ice sheets are remote and are difficult to observe in detail, the errors involved in estimating how they change are large. The best estimates indicate that while the Greenland and Antarctic ice sheets are near balance, glaciers and ice caps are shrinking worldwide, contributing as much as 0.25 millimeters (0.01 inch) per year to global sea-level rise.
Modern Glacier Retreat.
Mountain glaciers are always changing because they tend toward balance with ever-changing snowfall and melting rates. Some special glaciers change volume for other reasons . "Surge-type glaciers" experience rapid speed-ups that move ice downstream quickly, thinning the glacier, followed by quiescent periods in which the ice thickens once again. "Tidewater glaciers" end as a floating ice tongue in a lake or bay, where interaction with the lake bottom or seafloor, and iceberg calving events may complicate their flow.
Yet despite all the possible complications, glaciologists conclude that worldwide, glaciers are retreating rapidly as climate warms. For example, the glaciers of Mount Kilimanjaro, about which Hemingway wrote in 1938, are predicted to be gone by 2020. Ice first started to accumulate on that mountain nearly 12,000 years ago. Alaskan glaciers, measured with laser from a low-flying airplane, are thinning rapidly and contributing as much as 0.14 millimeters (0.005 inches) per year to sea level. The thinning rate has increased within the last decade. In Antarctica, ice-shelf collapse along its northward-reaching peninsula has also been linked to ongoing warming. Glacier retreat also is being monitored in the Himalayas, where increased melting can lead to flood risks for people living downstream. Around the world, glaciers are retreating in response to warming weather, and water resources and sea level will continue to be affected as they do.
Antarctic Ice Shelf Breakups.
Iceberg calving is an efficient and normal process by which floating ice shelves maintain a steady mass balance over many years; but it also can be an important indicator of climate change. While temperatures in the interior of Antarctica have remained fairly steady since scientists arrived on the continent, the Antarctic Peninsula has warmed about 2.5°C over the last half of the twentieth century.
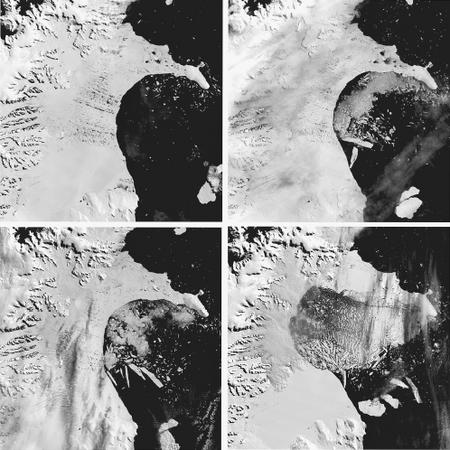
An ice shelf is a floating ice mass that is attached to the coast along at least one edge. The year 2002 brought notable events involving Antarctic ice shelves. Two massive icebergs broke off from the Ross Ice Shelf, a large sheet of glacial ice and snow extending from the Antarctic mainland into the southern Ross Sea. In a different event, an enormous piece broke away from the Larsen B Ice Shelf, located on the eastern side of the Antarctic Peninsula, in the largest single event in a 30-year series of ice-shelf retreats.
In the Larsen B Ice Shelf event, which reduced the shelf to a size not seen for about 12,000 years, a 3,275-square-kilometer (1,260-square-mile) sector disintegrated over the course of 35 days. The rapid break-up of the floating ice mass, which had survived thousands of years of climate variations, came at the end of one of the warmest summers on record.
When summertime temperatures rose close to and above freezing, snow on the surface of the Larsen Ice Shelf began to melt, eventually forming kilometers-wide ponds. That water is believed to have filled crevasses, which are deep, wedge-shaped cracks in the surface of the ice. Because water is denser than ice, it exerts extra pressure on the sides of a crevasse that can
Scientists cannot yet attribute specific ice events to global warming, due to lack of specific long-term data that would yield definitive causal relationships. Recent events must be viewed in the context of long-term, natural processes as well as the relatively short-term body of data collected since the Industrial Revolution .
Records of Climate Change
In addition to being affected by climate change, glaciers and ice sheets are archives of climate-change data. Each winter, new snow falls on the surface of the glacier. Whatever snow does not melt during the following summer will be buried by more snow the next winter. This "old snow" is called firn. The frozen water molecules and air trapped in the firn record the chemistry and temperature of the water vapor from which the snow formed and the atmosphere from which it fell.
As each year's firn layer is buried, that climate record is buried as well. The firn layers move down from the surface and are compressed as new layers pile on top. Eventually, the firn becomes dense, glacier ice. Most of the air has been squeezed out of the ice, but a few bubbles remain. When glaciologists drill down through the ice, they are drilling backward in time; consequently, ice cores drilled from glaciers and ice sheets reveal both regional and global climate trends.
The longest ice-core climate record comes from Vostok, a Russian scientific station in East Antarctica. The ice sheet is 3,623 meters (2.2 miles) thick at Vostok Station, and reaches back in time more than 400,000 years. The ice and the bubbles trapped within it have been studied by glaciologists from Russia, France, and the United States.
The ice core reveals that global atmospheric carbon dioxide (CO 2 ), methane (CH 4 ), and dust content rise and fall as global temperature and ice volume change. When the climate is warm, atmospheric CO 2 and CH 4 concentrations are large, and when climate is cool, those gases are less abundant. Atmospheric dust concentration changes in an opposite sense, indicating that warm, interglacial atmospheres are relatively moist, whereas in glacial times, the global atmosphere is relatively dry. These records also show that the present-day CO 2 level is larger than it was in the past warm times between glaciations.
Ice cores retrieved from mountain glaciers record both global and local changes. For example, ice cores from glaciers in Peru and Bolivia (in South America) are being used to establish how tropical climate and the Amazonian rain forest change as Earth's climate warms and cools. These ice cores also contain long records of the El Niño Southern Oscillation. Tropical glaciers are melting fast as climate warms, and as that happens, their contribution to water resources decreases, their contribution to global sea level increases, and a valuable climate archive is lost.
SEE ALSO El NiÑo and La NiÑa ; Glaciers and Ice Sheets ; Global Warming and Glaciers ; Global Warming and the Hydrologic Cycle ; Global Warming and the Ocean ; Hydrologic Cycle ; Ice Ages ; Ice at Sea ; Ice Cores and Ancient Climatic Conditions ; Isotopes: Applications in Natural Waters ; Sea Level .
Christina Hulbe
Bibliography
Dyurgerov, M. B., and M. F. Meier. "Year-to-Year Fluctuations of Global Mass Balance of Small Glaciers and their Contribution to Sea Level Changes." Arctic and Alpine Research 29 (1997):392–402.
Fairbanks, R. G. "A 17,000-Year Glacio-Eustatic Sea Level Record: Influence of Glacial Melting Dates on the Younger Dryas Event and Deep Ocean Circulation." Nature 342 (1989):637–642.
Intergovernmental Panel on Climate Change. Climate Change 2001: The Scientific Basis. Geneva, Switzerland: World Meteorological Organization and UN Environment Programme, 2001. Available online at <http://www.grida.no/climate/ipcc_tar/wg1/index.htm> .
Petit, J. R. et al. "Climate and Atmospheric History of the Past 420,000 Years from the Vostok Ice Core, Antarctica." Nature 399 (1999):429–436.
Scambos, T. A. et al. "The Link between Climate Warming and Break-up of Ice Shelves in the Antarctic Peninsula." Journal of Glaciology 46 (2000):516–530.
Thompson, L. G. et al. "Late Glacial Stage and Holocene Tropical Ice Core Records from Huascarán, Peru." Science 269 (1995):46–50.
Vaughan, D. G., and C. S. M. Doake. "Recent Atmospheric Warming and Retreat of Ice Shelves on the Antarctic Peninsula." Nature 379 (1996):328–331.
Internet Resources
Larsen Ice Shelf 2002. Portland State University. <http://web.pdx.edu/~chulbe/science/Larsen/larsen2002.html> .
NSF Office of Polar Programs. National Science Foundation. <http://www.nsf.gov/od/opp> .
The National Snow and Ice Data Center. <http://nsidc.org> .
A MODERN ICE ADVANCE
During the Little Ice Age (LIA), from about 1400 to 1900 C.E., glaciers advanced worldwide. In the European Alps, LIA glaciers overran farms, and falling ice blocks even crushed a few buildings, most famously near Chamonix, France.
STATE-SIZED ICE MASSES
The Ross Ice Shelf in Antarctica is the largest ice shelf today: it is the size of the state of Texas. In 2000, one of the largest icebergs ever observed broke off the Ross Ice Shelf near Roosevelt Island. Designated as B-15, its initial 11,000-square-kilometer (4,250-square-mile) area was almost as large as the state of Connecticut.