Sea Level
Sea level is defined as the height of the sea surface above an equipotential surface, called the geoid. The geoid is where the sea surface would come to rest in the absence of tides, water density variations, currents, and atmospheric effects. If the oceans did not move and there were no tides or wind, the sea surface and geoid would be the same surface.
Mean Sea Level
Because of tidal and wind-driven changes, sea level is constantly fluctuating. Therefore, it is important to calculate the mean sea level, which is the average sea level at a given location over several years.
Global changes in the mean sea level, which are due to other factors than those discussed above, are known as eustatic sea level changes. Over the twentieth century, global sea level has risen on the average of 2.0 millimeters (0.08 inches) per year for a total of 10 to 25 centimeters (3.9 to 9.8 inches). According to a recent Environmental Protection Agency study, it is expected to rise at least another 20 centimeters (7.8 inches) by 2100.
Causes of Eustatic Variations
Eustatic variations in sea level are the effects of external forces. Most experts agree that human-induced global warming is the force behind the current global sea-level rise. Three factors primarily affect eustatic sea level change: thermal expansion of the ocean; melting of nonpolar glaciers; and change in the volume of the ice caps of Antarctica and Greenland.
As the global climate warms, the average level of the ocean is gradually increasing, because warmer water occupies a greater volume. The warmer climate also is causing the melting of mountain and nonpolar glaciers, which adds volume to the oceans. As of 2002, no firm evidence existed that the volume of polar glaciers was changing, and this factor is not expected to affect eustatic sea level over this century.
Impacts of Rising Sea Level
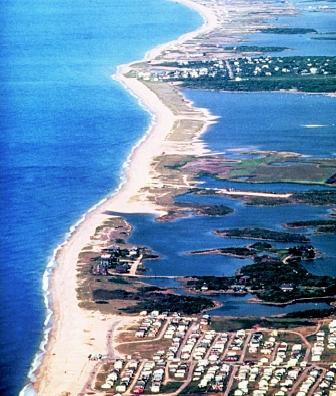
Rising sea level has many impacts on coastal areas. Although an increase in sea level will not necessarily affect the intensity of storms, such as hurricanes, it does increase the vulnerability of coastal areas to severe storms. Because coasts are densely populated, more than 100 million people are

A rise in sea level causes five primary physical effects:
- Erosion of beaches and bluffs;
- Increased flooding and storm damage;
- Inundation of low-lying areas;
- Salt-water intrusion into aquifers and surface waters; and
- Higher water tables .
Beach Erosion.
Of the five impacts noted above, beach erosion is the most common problem associated with rising sea level. Depending on beach composition, beaches erode by about 50 to 200 times the rate of sea level rise. That translates a 2-millimeter (0.08-inch) per year increase in sea level eroding from 10 to 40 centimeters (3.9 to 15.6 inches) of coastline per year.
Beach erosion has not only a strong ecological impact, but also a profound economic impact. Over the last decade of the twentieth century, the U.S. government spent in excess of $30 million annually in beach nourishment projects. These costs will only continue to grow as the coasts erode at accelerated rates. *
Regional Processes
Many regional processes can affect one coastline and not another. The position and height of sea level relative to a particular coast is termed relative sea level.
Although the average eustatic sea-level rise is 2.0 millimeters (0.08 inch) per year, sea level is not changing everywhere in the world at the same rate. The average rate of sea-level rise along the U.S. coasts has been around 2.5 to 3.0 millimeters (0.10 to 0.12 inch) per year over the last century. However, the rate varies from a rise of 1.0 centimeter (0.39 inch) per year along the Louisiana coast to a drop of 3.0 to 4.0 millimeters (0.12 to 0.16 inch) per year in Alaska (see graph).
Post-Glacial Rebound.
The primary reason for inconsistencies in relative sea level is regional subsidence and emergence of land due to post-glacial rebound . During the last glacial period, approximately 18,000 years ago, enormous glaciers covered continental areas. The land beneath these glaciers subsided due to the added weight. When the ice melted at the end of this period, the land began to emerge again, and continues to do so today. Other factors that can causes changes in relative sea level are either uplift or subsidence related to tectonic processes, fluid withdrawal, and sediment deposition and compaction.
During a period of glaciation, the average global temperature drops considerably and the volume of the ocean decreases greatly. The water that would otherwise be in the ocean is frozen as ice in continental glaciers, or as sea ice in the oceans. During the peak of the last glacial period, global sea level was approximately 100 meters (328 feet) lower than it is today. Only when the temperature began to warm did the glaciers melt and flow back into the ocean. This is just one example of how the global climate can have a substantial effect on sea level.
Measuring Sea Level
Several methods can be used to measure sea level. The length of the record desired typically determines the method used.
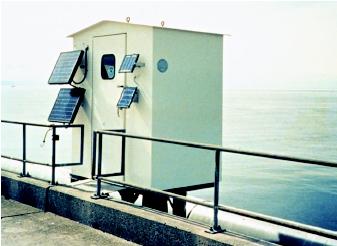
Tide Gages.
Some of the longest records regarding sea-level changes are from tide gages. Tide gages typically are located on piers and measure the sea level relative to a geodetic benchmark on land.
Although tide gages commonly are used, a drawback is that they measure relative sea level at a specific location rather than global sea level. If the land where the tide gage is located subsides, the tide gage will record a relative increase in sea level, but not a eustatic one.
To infer global sea level from tide gage records, the effect of post-glacial rebound needs to be factored into the measurement recorded. In addition, tide gages are sparsely located in coastal regions and cannot be used to record the sea level in the open ocean.
Satellite Altimeters.
Satellite altimeters have been used to measure global sea level height. The spatial coverage and accuracy of these satellite altimeters has been excellent, but the short length of the record (only since the latter half of the twentieth century) makes it difficult to determine any pattern in sea-level change.
SEE ALSO Beaches ; Climate and the Ocean ; Coastal Ocean ; Corals and Coral Reefs ; Estuaries ; Oceanography from Space.
Amy J. Bratcher
Bibliography
Douglas, Bruce C. et al, eds. Sea Level Rise: History and Consequences. San Diego, CA:Academic Press, 2001.
Houghton, J. T., et al, eds. Climate Change 1995: The Science of Climate Change. Contribution of Working Group I to the Second Assessment Report of the Intergovernmental Panel on Climate Change. Cambridge, U.K.: Cambridge University Press, 1996.
Internet Resources
Global Warming—Sea Level. U.S. Environmental Protection Agency. <http://yosemite.epa.gov/oar/globalwarming.inst/content/index.html> .
Sea Surface and Sea Level. Atmospheric Radiation Measurement Program. <http://www.arm.gov/docs/education/background/seavari.html> .
* See "Beaches" for a photograph of beach nourishment.
Comment about this article, ask questions, or add new information about this topic: